
Client Profile:
Premium skincare and dermatology clinic chain with multiple locations across a metro city
(Annual revenue: ~$3.5 million USD; doctor-led brand with high marketing and operating overheads)
Key Challenges:
- Founders lacked visibility into branch-level profitability and performance KPIs
- No clarity on cost per service due to bundled pricing and unallocated expenses
- High utility and operating costs across locations, with no tracking or control system
- Financial reports were delayed and disconnected from operational metrics
CFO Pulse Approach:
🔰 CFO Shield (Stage 1)
- Cleaned up accounting structure to accurately allocate revenue and costs across clinics
- Created cost structures per treatment type, factoring in doctor time, materials, and equipment use
- Implemented standardized monthly closing and internal reporting practices
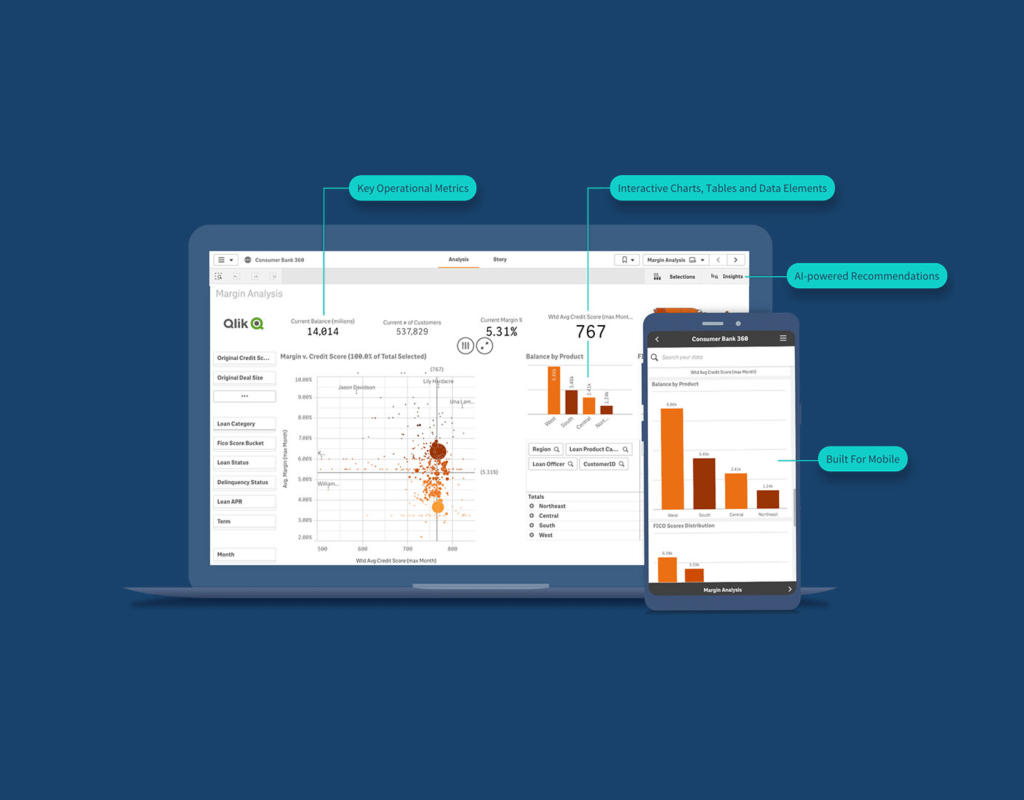
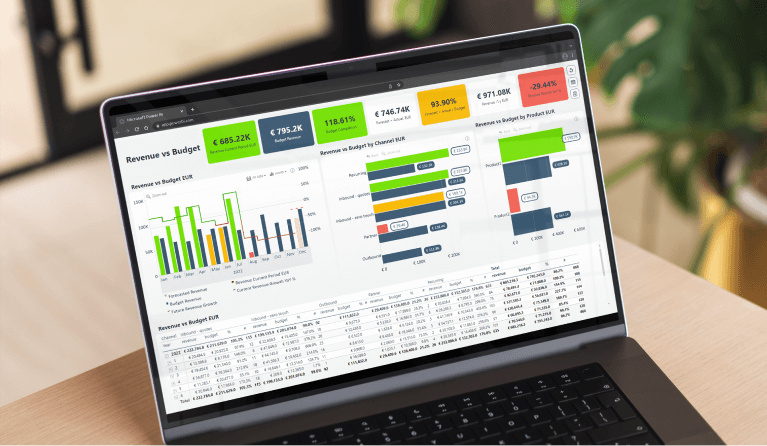
📊 CFO Dashboard (Stage 2)
- Built real-time Power BI dashboards to monitor revenue per clinic, service, and practitioner
- Created operational dashboards to track electricity consumption, inventory usage, and prepaid package redemption
- Enabled live view of collections, appointments, and cash balances
🔍 CFO Lens (Stage 3)
- Identified low-margin services with high delivery cost
- Detected inefficiencies in utility consumption — particularly in 2 high-footfall clinics
- Optimized service scheduling to increase average revenue per doctor-hour
🧠 CFO Brain (Stage 4)
- Advised management to reprice 9 key services based on cost insights and market benchmarks
- Rolled out a performance-linked bonus structure for branch managers using profitability KPIs
- Built an expansion model using per-location breakeven and ROI projections
Tangible Results:
- Improved EBITDA margin by 5.2% YoY through pricing corrections and cost rationalization
- Reduced annual energy costs by ~$6,000 USD across three clinics
- Improved real-time financial control and branch-level accountability
- Built a scalable FP&A framework to support expansion into two new cities