Introduction
In a world where CFOs once lived and breathed Excel, a global shift is underway. Financial leaders across the USA, Australia, UAE, Canada, Europe, Singapore – virtually everywhere – are trading in complex spreadsheets for dynamic Power BI dashboards. This shift from Excel-based reporting to Power BI isn’t just a tech upgrade; it’s a transformational change in how businesses report, analyze, and strategize with their data. The reason is simple: Excel, while beloved, is prone to errors and static in nature, whereas Power BI offers real-time, visual insights at a click. In fact, studies have found that nearly 90% of spreadsheets contain errors, highlighting the risk of relying solely on manual Excel reports qashqade.com. It’s no wonder organizations globally are embracing a more robust, interactive solution.
From Static Spreadsheets to Interactive Dashboards: The Global Shift
For decades, Excel was the de facto tool for financial reporting – countless CFOs have spent late nights copying data into cells and double-checking formulas. But as companies grew and data exploded, cracks in the spreadsheet approach became clear. Manual data manipulation in Excel is time-consuming and error-prone linkedin.com. Different versions of files float around through emails, creating confusion about which numbers are the latest and correct. Excel also struggles with big data; giant workbooks can crash or become unwieldy, and there’s always that looming row limit. Perhaps most critically, Excel reports are usually static snapshots – once you’ve generated a report, any new data means regenerating or updating again by hand.
Enter Power BI, and suddenly financial reporting steps into the modern age. Power BI centralizes data from all your sources (ERP systems, databases, even those Excel files) into one unified real-time dashboard. Instead of static tables, you get interactive visuals that update automatically. No more “version control” nightmares or wondering if you remembered to refresh that pivot table gocollectiv.comgocollectiv.com. With Power BI connected to your live data sources, your reports refresh in real time, so you always have the latest information at your fingertips. This means a CFO in New York and a Finance Manager in Dubai can be looking at the same up-to-the-minute figures and drill down into details with a few clicks. It’s a global game-changer – companies worldwide are swapping out static spreadsheets for these real-time dashboards to stay agile and data-driven.A Virtual CFO is a highly experienced finance professional or consulting firm that provides strategic financial guidance, planning, forecasting, and performance monitoring—remotely and cost-effectively. Unlike traditional CFOs who work full-time and demand high compensation, V-CFOs work flexibly, offering businesses the best of both worlds: expertise without the overhead.
Real-Time, Visual, and Drill-Down Reporting with Power BI
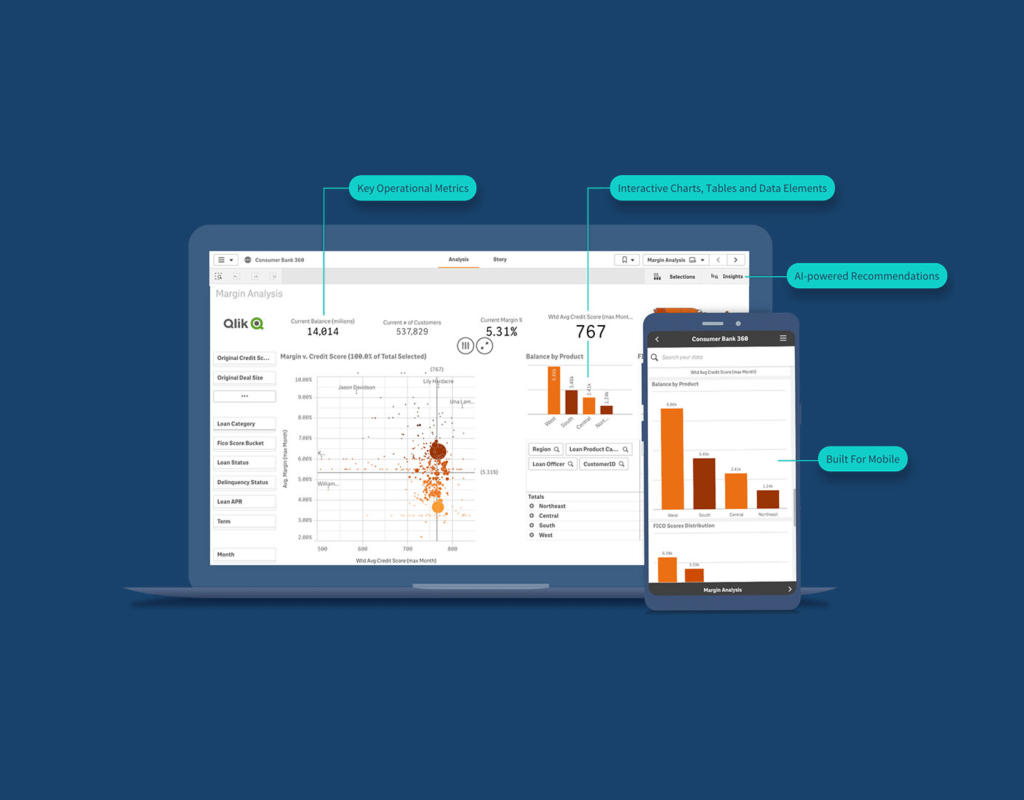
One of the biggest attractions of Power BI is how it makes financial data come alive through visuals and interactivity. Think of the difference like moving from a black-and-white report to a full-color, interactive exhibit. Instead of poring over endless rows of numbers, Power BI gives you charts, graphs, and maps that you can hover over and click to see deeper details. CFOs and executives can start at a high-level overview and then drill down into the data – all within the same report. For example, clicking on a revenue figure in a Power BI dashboard might break it down by region or product, allowing instant investigation of variances or trends. This drill-down capability turns reporting into a conversation: you ask a question (“Why are expenses up this quarter?”) and the dashboard can literally show you the answer by slicing the data.
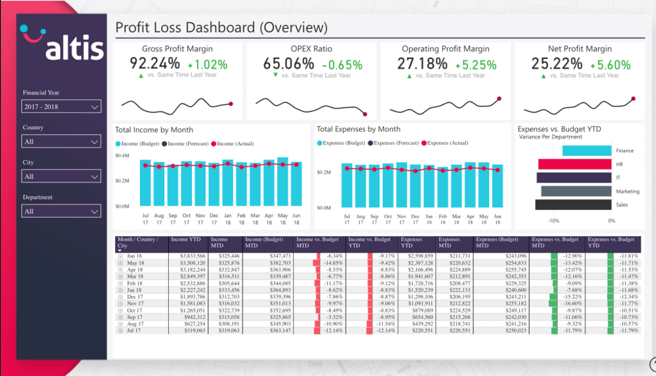
An example of a Power BI financial dashboard providing a Profit & Loss overview. Such visual dashboards let decision-makers see key metrics (like profit margins, operating costs, and net margins) at a glance and then interactively drill into monthly trends and variances.
Beyond static charts, Power BI enables truly real-time analysis. Data streaming and scheduled refreshes ensure your visuals are current, so you can watch today’s sales numbers tick upward or see up-to-the-minute cash positions. Contrast this with Excel, where producing a “real-time” view would require someone to constantly re-run reports. As one analytics expert put it, Power BI connects directly to your data sources and updates in real time, freeing finance teams to focus on analyzing trends rather than manually rebuilding charts gocollectiv.com. Moreover, Power BI’s superior visualization tools offer an array of interactive charts, from drillable maps to gauge charts, that Excel simply can’t match. The result is reporting that’s not only timely but also easy to digest. Even non-financial stakeholders can grasp insights quickly because the data is presented in an intuitive, visual way. This democratization of data understanding means better, faster decisions at all levels of the business.
Industry Examples: Manufacturing, E-Commerce, and Retail
Every industry has its own metrics and challenges, and Power BI’s flexibility shines in its ability to handle them all. Let’s look at how different sectors globally are leveraging Power BI to transform their financial and operational reporting:
- Manufacturing: In manufacturing, margins are thin and efficiency is king. Power BI allows plant managers and CFOs to monitor production costs, output, and profitability in one place. For instance, by integrating ERP and factory floor systems, a Power BI dashboard can track production volume, defect rates, and capacity utilization in real time. A manufacturing company can visualize terabytes of sensor data to detect bottlenecks and avoid delays – identifying areas where operational efficiency can improvemicrosoft.com. Financially, this means linking production metrics to costs: if a particular assembly line’s downtime is spiking, the CFO sees the impact on unit costs immediately. One manufacturing firm cited an enormous ROI (a Forrester study found a 366% ROI on Power BI) because faster access to integrated data led to better decisions and cost savings penonpartners.compenonpartners.com. In short, Power BI gives manufacturers a 360° view – from supply chain logistics to the financial ledger – enabling proactive adjustments that drive profitability.
- E-Commerce: Online businesses thrive on data, and Power BI helps e-commerce companies turn that data into actionable insights. Imagine a dashboard that shows your entire sales funnel in real time – from website visits all the way to completed purchases. With Power BI, e-commerce CFOs and analysts can track metrics like daily online sales, conversion rates, average order value, cart abandonment, and inventory levels in one consolidated view. For example, an e-commerce Performance Dashboard might display a live conversion funnel (how many site visitors add items to cart, proceed to checkout, etc.), alongside sales figures and stock levels. This is incredibly powerful for pinpointing where in the process customers drop off and what that means financially. In fact, specialized Power BI e-commerce dashboards let you gain insights into sales, customer behavior, and inventory, all aimed at optimizing your online store’s performance fugo.ai. A marketing manager in London and a CFO in Sydney can both look at the same real-time dashboard to see if today’s promo is boosting conversion, and whether inventory can keep up. These insights support data-driven strategy adjustments on the fly – if, say, one product category is trending with higher returns or lower margins, it’s immediately visible and can be addressed before it hurts the bottom line.
- Retail Chains: Multi-store retail businesses, from fashion franchises to supermarket chains, have to juggle store-wise KPIs, regional sales, and supply chain data – a perfect scenario for Power BI. Store managers, regional directors, and CFOs can all collaborate using shared Power BI dashboards that break down performance by store, region, and product. For example, Power BI can analyze retail sales data across dozens or hundreds of stores, comparing each store’s performance to targets or to last year’s figures. Metrics like same-store sales growth, gross margin by store, inventory turnover, and even new store ramp-up performance can be monitored interactively. Microsoft’s own retail sample model illustrates this well: it provides a dashboard analyzing sales of items across multiple stores and districts, comparing this year vs. last year on key measures like sales, units sold, gross margins, and even new-store analysis learn.microsoft.com. Power BI makes it effortless to drill down from a global view to a specific store’s results. A retail CFO can click on the Europe region, zoom into the UK, and further drill into a specific London store’s daily sales – all in seconds, without waiting for someone to run a report.
Retail Chains: Multi-store retail businesses, from fashion franchises to supermarket chains, have to juggle store-wise KPIs, regional sales, and supply chain data – a perfect scenario for Power BI. Store managers, regional directors, and CFOs can all collaborate using shared Power BI dashboards that break down performance by store, region, and product. For example, Power BI can analyze retail sales data across dozens or hundreds of stores, comparing each store’s performance to targets or to last year’s figures. Metrics like same-store sales growth, gross margin by store, inventory turnover, and even new store ramp-up performance can be monitored interactively. Microsoft’s own retail sample model illustrates this well: it provides a dashboard analyzing sales of items across multiple stores and districts, comparing this year vs. last year on key measures like sales, units sold, gross margins, and even new-store analysis learn.microsoft.com. Power BI makes it effortless to drill down from a global view to a specific store’s results. A retail CFO can click on the Europe region, zoom into the UK, and further drill into a specific London store’s daily sales – all in seconds, without waiting for someone to run a report.
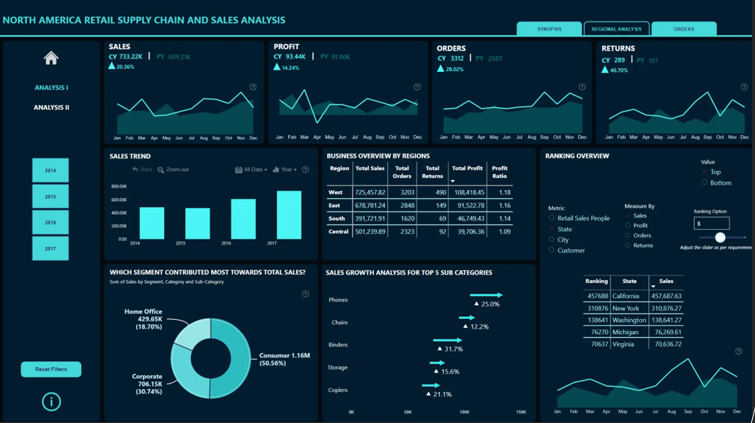
Furthermore, retail chains benefit from Power BI’s ability to merge financial and operational data. Inventory tracking is a great example: Power BI can highlight if a certain store is overstocked (tying up capital) or understocked (losing sales opportunities) by blending sales trends with inventory levels. Store-wise profitability becomes transparent, helping identify which branches are thriving and which might need strategic changes (like a different product mix or cost control measures). These industry-specific dashboards underscore a common theme – Power BI adapts to the KPIs that matter for your business, whether it’s manufacturing yield, website conversion, or retail stock-outs. And it delivers insights in real time, which is invaluable for international companies operating across time zones. When Monday’s sales close in Asia, a CEO in the U.S. can already see the numbers and trends from his Power BI app over morning coffee, no overnight Excel crunching required.
Power BI Dashboards: A CFO’s Strategic Ally
Modern CFOs are expected not only to report the numbers, but also to drive strategy with insights. Power BI has emerged as a strategic ally for CFOs and finance teams, because it aligns perfectly with these evolving demands. Instead of spending the whole week preparing static reports for the board, CFOs can leverage Power BI to automate much of the reporting and free up time for analysis and strategy. Strategic dashboards built in Power BI give a comprehensive view of the company’s financial health at a glance, but they also allow the CFO to play out scenarios and dive deeper when needed. Critically, Power BI supports CFOs by consolidating data from disparate sources into a single source of truth. Financial data often resides in multiple systems (accounting software, CRM,Excel files for budgets, etc.), and manually reconciling those is a headache. Power BI integrates all these sources and updates them continuously, so the CFO and other executives are always looking at the same up-to-date figures. This capability means less time spent verifying “which number is correct” and more time on what the numbers mean. As a result, financial reporting becomes faster and more accurate. According to experts, Power BI streamlines financial reporting by combining data into visually intuitive reports, so CFOs can analyze financial statements, cash flow, and profitability trends with ease – facilitating timely, informed decision-makingexeccapital.co.uk. For example, if a CFO notices a cash flow dip on the dashboard, they can click through to see if it’s driven by a slower collections in accounts receivable or perhaps a one-time expense – insights that might take days to compile in Excel are available in minutes with Power BI.
Another area where Power BI empowers CFOs is scenario planning and forecasting. With Excel, many finance teams build complex financial models, but sharing and iterating on them is cumbersome. Power BI, on the other hand, can take those models (through integration with Excel’s Power Query/Pivot or other data) and present interactive what-if analysis tools. CFOs can work with CEOs and department heads to model the financial impact of, say, a 10% increase in raw material cost or a new market expansion – and see the results live on a dashboard. This turns financial planning into a collaborative, data-driven exercise rather than a static report. Moreover, CFOs can set up strategic KPI dashboards that align with the company’s goals: for instance, a dashboard focused on working capital (tracking receivables, payables, inventory days), or one on profitability by product lines. These dashboards keep the entire leadership team aligned on key financial objectives. And because Power BI is accessible on all devices (including mobile), an international CFO traveling from Singapore to London can pull up the latest numbers on their tablet and stay in the loop on strategic metrics.
Finally, consider compliance and risk – areas every CFO is mindful of. Power BI’s ability to continuously monitor data means CFOs can also set up alerts and visuals for things like budget variances or unusual transactions. In a sense, the CFO dashboard becomes an early-warning system, not just a rear-view mirror. All of these capabilities elevate the role of finance from just reporting results to actively driving strategy. With real-time dashboards and data-driven strategy insights, CFOs become the navigators of the business, not just the scorekeepers.
Power BI vs Excel: A Comparative Look for Financial Reporting
It’s worth explicitly comparing Power BI and Excel, since many finance professionals initially wonder if they really need a new tool. The truth is, Excel and Power BI each have their place, but for financial and operational reporting, Power BI offers distinct advantages that Excel can’t easily match:
- Data Capacity and Integration: Excel has inherent limits – it can technically hold about a million rows per sheet, but anyone who’s tried using a massive Excel file knows how quickly it becomes sluggish. Power BI, built on a powerful columnar database engine, can crunch millions of rows of data with ease. It’s designed to pull in data from multiple sources (SQL databases, cloud services, ERP systems, etc.) and combine them. Instead of manually copying data into Excel from various systems, Power BI acts as a live pipeline, merging everything. This not only saves time but reduces errors since there’s less manual intervention. (Remember those nearly 90% of spreadsheets with errors – a risk greatly mitigated when using automated data refreshes in Power BI qashqade.com!)
- Automation and Real-Time Updates: In Excel, if you want to update a report, you often have to import new data or adjust formulas and then re-distribute the file. It’s a largely manual refresh process. Power BI flips this around with automation – you set it up once, and the data updates automatically on a schedule or in real time. Financial reports in Power BI can be scheduled to refresh after the books close each day, or even live-stream data (for example, pulling the latest stock prices or sales transactions every few minutes). This means stakeholders are always looking at the latest numbers without someone having to send out a new file. The impact on decision-making is huge: faster, more reactive, and based on current informationgocollectiv.com.
- Interactive Visualization: Excel has charts and even PowerPivot/PivotTables for some interactivity, but Power BI was born to do visuals. In Excel, if you want a new view of the data, you often have to create a new pivot or chart. In Power BI, the user can click and filter right in the dashboard. Slicers, drill-downs, and even natural language query (“Show me sales by region for 2024”) are built in. The rich visuals and intuitive interface mean that even non-analysts can engage with the data. For instance, an operations manager might not be an Excel whiz, but they can easily click a few filters on a Power BI report to get the insight they need. Excel is largely single-user and static in its output, whereas Power BI is multi-user and interactive by design.
- Collaboration and Access: How many times have teams emailed Excel files back and forth, or struggled with version control on a shared drive? With Power BI, dashboards are online and access-controlled. Multiple people can view (or edit, if permitted) the same report via the cloud service or mobile app. There’s one version of the truth, and everyone sees it. This level of collaboration is increasingly critical for global businesses – a finance team spread across New York, London, and Singapore can work from one shared dashboard rather than maintaining separate regional Excel reports. Additionally, Power BI has robust security and sharing features (you can share a report with a colleague with a simple link and set their access level). No more “out-of-date attachment” issues.
- Advanced Analytics and AI: While Excel has some analysis ToolPaks and you can write complex formulas or macros, Power BI leverages more advanced analytics easily. Out-of-the-box, it can detect trends, forecast future values, and even run AI visualizations that find key influencers in data. For example, a CFO could use a Power BI visual to automatically explain what factors are most strongly affecting an increase in overhead costs. Doing that in Excel would require significant manual analysis or complex regression formulas. In Power BI it’s a click. Moreover, Power BI integrates with other advanced tools (like Python or R scripting, and Microsoft’s AI services) for those who need to go deeper. It’s a platform designed to grow with the complexity of questions you’re asking. Excel, brilliant as it is, was designed in an era before big data and AI – and it shows.
To be clear, Excel still has its place for quick ad-hoc analysis and modeling. In fact, Power BI and Excel can work hand-in-hand – Power BI can source data from Excel, and Excel can even consume Power BI datasets for those who prefer Excel’s interface for certain tasks. But when it comes to regular reporting, dashboards, and sharing insights at scale, Power BI is increasingly the tool of choice globally. As one finance transformation expert noted, Power BI isn’t just a software upgrade from Excel – it’s a strategic development in finance teams’ capabilities, enabling moreefficient, accurate, and insightful reporting penonpartners.compenonpartners.com. The bottom line: Excel got us this far, but to navigate today’s fast-paced, data-heavy business world, Power BI is the modern vehicle that can carry financial reporting into the future.
CFOPulse: Power BI Solutions Tailored to Your Needs
At CFOPulse, we understand that adopting Power BI is not merely about installing a new tool – it’s about changing the way your finance function operates for the better. As a global financial consulting brand, our mission is to bridge the gap between raw data and strategic decision-making for CFOs and business leaders. We’ve seen firsthand how implementing Power BI can revolutionize a company’s reporting cadence and insight generation, but we also know that one size does not fit all. That’s why CFOPulse specializes in tailoring Power BI solutions to each client’s unique needs and financial strategy.
What does this mean in practice? It means our team doesn’t just drop in generic dashboards and walk away. We work closely with your finance and operations teams to identify the KPIs that truly drive your business – whether it’s retail KPIs like same-store sales and inventory turns, manufacturing metrics like yield and downtime, or e-commerce metrics like customer acquisition cost and LTV. Our experts (who speak the language of CFOs) then design Power BI dashboards and reports that align with your strategic goals. If your priority is improving profitability, we’ll help implement dashboards focusing on margin analysis by product, customer, or region. If cash flow management is key, we’ll build you real-time cash position and forecast reports. All of these solutions are built on the robust foundation of Power BI’s technology, but customized to highlight what matters most to you.
Another hallmark of CFOPulse’s approach is training and empowerment. We don’t just want to deliver pretty visuals – we want your team to fully leverage them. As part of our CFO services, we offer hands-on training for your staff and executives on how to use and interpret the new dashboards. We also ensure the technical setup is sound: connecting your data sources securely, establishing automated data refresh schedules, and setting up role-based access so that sensitive financial data is only seen by the right eyes. Our consultants have experience with international clients, so whether you’re a retail chain in Toronto or a manufacturing firm in Melbourne, we account for any localization needs (like multi-currency reporting, regional compliance metrics, etc.). CFOPulse marries financial acumen with Power BI expertise – meaning we don’t just hand you a tool, we deliver a solution that fits into your overall financial strategy and elevates it.
Crucially, we view Power BI dashboards not as an end product, but as a living, evolving asset. As your business grows or strategy shifts, CFOPulse is there to adapt your BI solutions. Expanding into the Middle East market and need new KPIs on your dashboard? We’ve got you. Looking to integrate a new cloud accounting system? We’ll connect it. Our goal is to build a long-term partnership where Power BI becomes an engine of continuous insight for your organization. With CFOPulse’s implementation and support, CFOs can confidently steer their companies with a data-driven strategy, knowing they have reliable, real-time dashboards to back every decision.
Conclusion: Embrace the Future of Financial Reporting
Excel has been a faithful workhorse for finance professionals, but the future of financial reporting is here, and it’s embodied by tools like Power BI. The global trend is unmistakable: businesses big and small, across continents and industries, are embracing interactive, real-time dashboards to drive efficiency and insight. Power BI is revolutionizing financial reporting globally by providing a platform where your data isn’t just recorded, but actively illuminates the path forward – from uncovering a bottleneck in a manufacturing line, to highlighting a hot-selling product in your retail stores, to giving CFOs a strategic cockpit for the company’s financial flight.
The time to modernize your reporting is now. Adopting Power BI not only frees your teams from manual Excel drudgery and potential errors, but it also unlocks a new level of analytical capability that can sharpen your competitive edge. This transformation is as much about culture and strategy as it is about technology – it’s about becoming a truly data-driven organization. With real-time insights at your fingertips, you can respond faster to market changes, make informed strategic pivots, and ultimately drive better business outcomes.
Ready to embark on this journey? CFOPulse is here to guide you every step of the way. We combine deep financial expertise with hands-on Power BI experience to ensure your transition is smooth and tailored to your needs. Whether you’re a CFO looking to build a strategic dashboard suite, or a CEO wanting clearer visibility across a global enterprise, we can help turn that vision into reality. Don’t let your organization fall behind in the spreadsheet era. Contact CFOPulse today to discover how our Power BI solutions can empower your finance team and elevate your decision-making. Let’s transform your financial reporting into a competitive advantage – and let data drive your success story moving forward.