
Client Profile:
Digitally native fashion brand selling through own website and major marketplaces
(Annual revenue ~₹30 Cr; pan-India operations; D2C + Marketplace hybrid model)
Key Challenges:
- No visibility into region-wise product performance or logistics cost leakage
- Inventory was overstocked in low-performing warehouses, increasing fulfillment costs
- Margins differed significantly across SKUs, but data was not accessible in one place
- Financial reporting was fragmented across platforms (Shopify, Amazon, Flipkart)
CFO Pulse Approach:
🔰 CFO Shield (Stage 1)
- Mapped SKU-level COGS and ensured proper recording of fulfillment, marketing, and return costs
- Integrated data from multiple sales channels into a centralized finance system
- Created uniform cost heads for accurate margin tracking
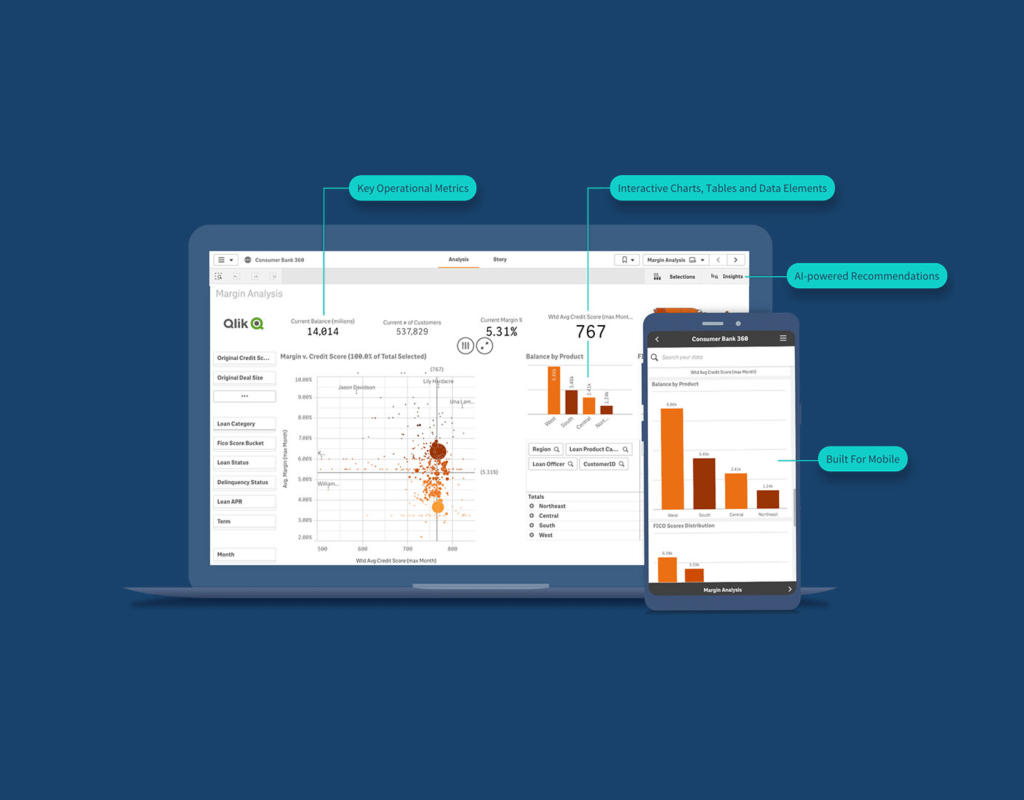
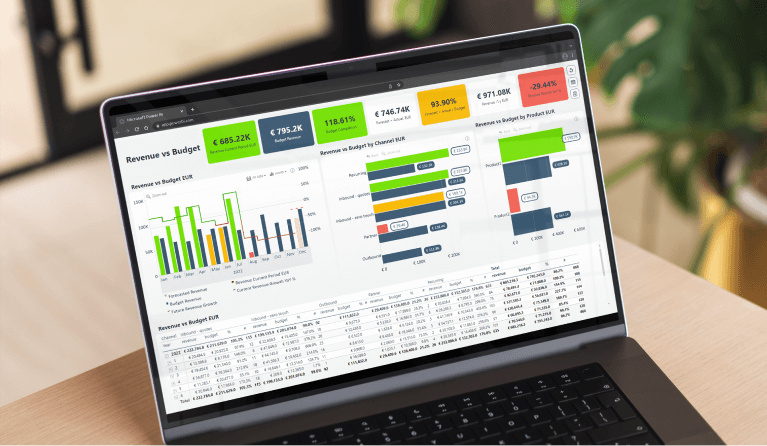
📊 CFO Dashboard (Stage 2)
- Developed Power BI dashboards showing SKU-wise, region-wise, and channel-wise profitability
- Visualized return rates, delivery time, and logistics cost per order
- Built a real-time sales vs inventory heatmap to flag slow movers
🔍 CFO Lens (Stage 3)
- Identified that checkered shirts sold 3x better in South India, while printed designs performed better in West
- Helped reduce dead stock by 23% through inventory reallocation
- Exposed that one channel was eroding 8% margins due to high return & COD failure rates
🧠 CFO Brain (Stage 4)
- Advised on pricing corrections across 15 SKUs based on customer acquisition cost and fulfillment margins
- Built a demand-forecasting model to support smarter purchase planning
- Helped client shift to a decentralized fulfillment strategy, optimizing delivery speed & cost
Tangible Results:
- Reduced logistics costs by 23% through regional SKU optimization
- Increased gross margin by 6.7% by eliminating unprofitable product-channel combinations
- Built a live business cockpit for founders to track sales, returns, and profitability in real-time
- Enabled data-backed decisions on product expansion and discount strategy